 Fragranza
Fragranza: from sales value to net profit, with +165.5% orders
+165.5%
Meta orders, year over year
4,611 → 12,240
€1,911,360
Value on Google
new account, from scratch
19.35x
Google ROAS
from 21,512 conversions
−12.7%
Meta cost per purchase
on a 131.9% bigger budget
POAS vs ROAS two units of measurement
ROAS divides sales value by budget: how much the store took in. POAS divides net profit by the same budget: how much it kept.
Meta was switched to POAS in November 2025, while Google stayed on ROAS. That is why the two platforms are never added together anywhere on this page. Profit is before ad spend and fixed costs.
This case study was produced by the performance marketing agency BigConvert, based on data from the accounts we manage.
The data was checked and validated by the team at Fragranza.
- Client
- Fragranza
- Industry
- Perfumery
- Services
- POAS, Google Ads, Meta Ads
- Market
- Romania
- Period
- Nov 1, 2025 – Aug 13, 2026
What changed
The definition of the metric, not the performance
In November 2025 we changed what we import into Meta: not the order value, but the profit left from it. Since then, the report has shown a 75.6% drop in the multiple. It isn't a drop, it's the moment the number started measuring something else.
Before · Nov 2024 – Aug 2025
42.61x
ROAS, on sales value
- Imported value
- €485,538
≠ Different bases,
not comparable
After · Nov 2025 – Aug 2026
10.39x
POAS, on net profit
- Imported value
- €274,597
What can be compared across the change of base
4,611 → 12,240
Orders, counted identically in both periods
+165.5%Real growth
10.39x is the real number. It replaces a 42.61x that measured money taken in, not money kept.
The effect
What happened in the account
-
The decision
We made the report look worse, on purpose
Meta went from importing sales value to importing net profit. The multiple came down from 42.61x to 10.39x, and the imported value from €485,538 to €274,597 – both consequences of the change in unit of measurement, not of performance.
-
The result
What the comparable metrics show
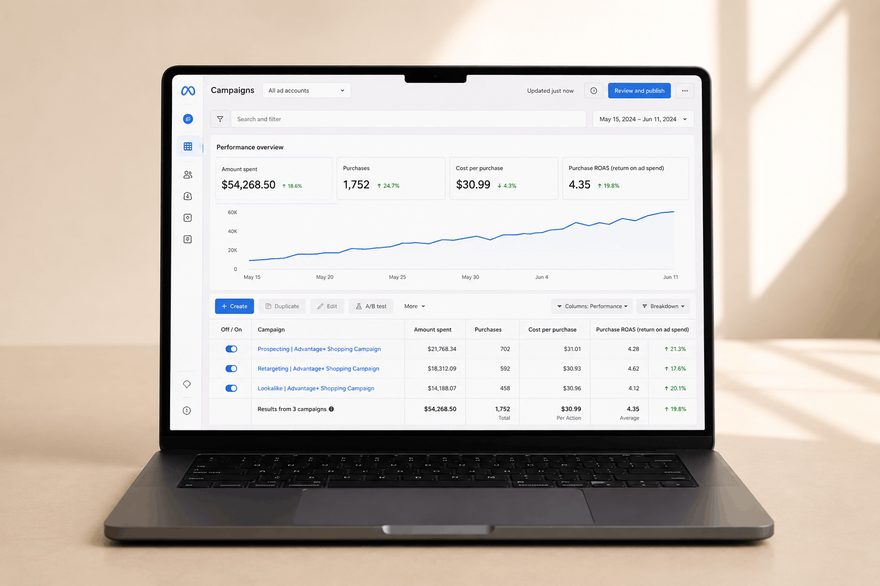
Orders grew by 165.5% on a 131.9% bigger budget, so faster than the budget. Cost per purchase fell by 12.7%, and reach doubled.
Orders and budget on Meta, indexed to 100
100 = the same calendar window in the previous year
Orders grew faster than the budget, which grew by 131.9%.
Cost per purchase fell, at more than twice the volume.
Meta Ads Manager · year-over-year comparison
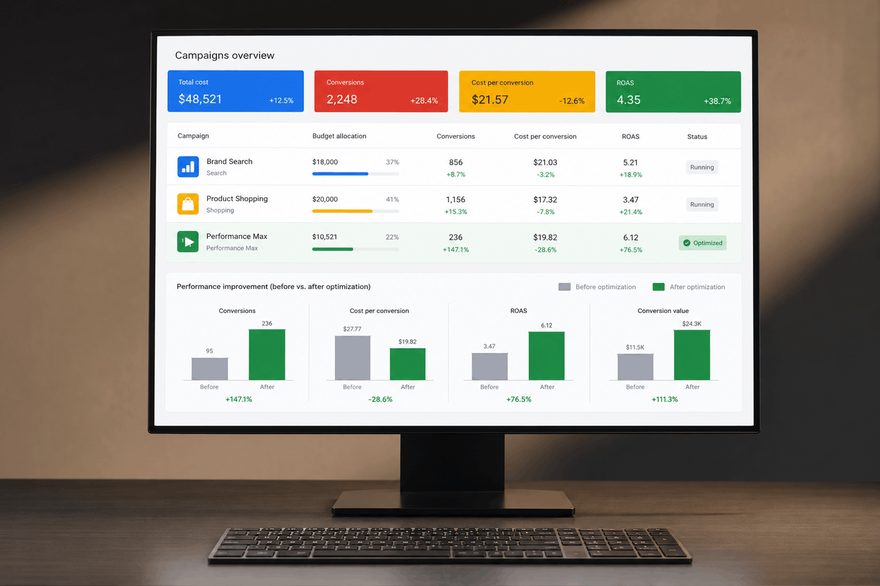
The other half started from zero
There was no takeover and no history. In nine and a half months, the new account generated €1,911,360 at 19.35x, from 21,512 conversions. Here the value is sales value, not profit: Google runs on classic ROAS, so the two accounts can't be added together.
Performance Max Search Shopping
Google Ads · the new account's growth
The system
What can be repeated
The order matters. The change of unit of measurement comes before the budget increase, not after.
-
You decide what you measure
You decide whether the platform receives revenue or profit. That choice determines which products the algorithm will push.
-
You accept the break in the report
Changing the base makes the history non-comparable. From day one, you establish which metrics stay valid.
-
You grow on the valid metrics
The budget goes up while you track volume and cost per purchase, the only ones undisturbed by the change.
See the full report
The tables for each platform, what we don't take credit for and the methodology notes.
What we don't take credit for
- The sales that already existed on Meta aren't ours. The account was producing 4,611 purchases before we started working together, so the 165.5% growth starts from a base that was already working.
- We don't claim profit growth on Meta. The previous period didn't record profit, only sales value, so we have no figure to compare against.
- Brand search would largely have come anyway. Brand campaigns produced €300,626 of the €1,911,360 on Google, i.e. 15.7%, at 39.90x. The rest of search, the non-brand part, ran at 7.45x – that is the number that measures new demand.
- We don't publish a combined figure across the two platforms. Google reports sales value, Meta reports net profit; adding them would produce a meaningless number.
- We don't claim the company's final profit. The value imported into Meta is profit after variable costs, but before ad spend and fixed costs.
Meta Ads · year over year
| Metric | Nov 2024 – Aug 2025 | Nov 2025 – Aug 2026 | Change |
|---|---|---|---|
| Purchases | 4,611 | 12,240 | +165.5% |
| Link clicks | 174,241 | 423,755 | +143.2% |
| Impressions | 3,658,441 | 11,617,535 | +217.6% |
| Reach | 559,398 | 1,299,749 | +132.3% |
| Budget | confidential | confidential | +131.9% |
| Cost per purchase | confidential | confidential | −12.7% |
| Imported value | €485,538 sales value | €274,597 net profit | not comparable |
| Reported multiple | 42.61x ROAS | 10.39x POAS | not comparable |
Google Ads · new account
| Metric | Previous year | Period analyzed |
|---|---|---|
| Sales value | the account didn't exist | €1,911,360 |
| Budget | the account didn't exist | confidential |
| ROAS | the account didn't exist | 19.35x |
| Conversions | the account didn't exist | 21,512 |
| Average value per conversion | the account didn't exist | €88.85 |
| Clicks | the account didn't exist | 904,009 |
| Impressions | the account didn't exist | 36,039,061 |
Google, by campaign type
| Campaign type | Budget share | Sales value | ROAS |
|---|---|---|---|
| Performance Max | 76.8% | €1,426,126 | 18.80x |
| Search | 15.1% | €355,922 | 23.79x |
| Shopping | 8.0% | €129,312 | 16.31x |
Methodology and data notes
- Period: November 1, 2025 – August 13, 2026, versus the same window in the previous year. Source: campaign-level exports, in euros. Google totals are calculated exclusively from campaign rows, after removing 5 Total rows.
- Google: account created in November 2025, so there is no previous period and no year-over-year change can be calculated. It runs on classic ROAS, i.e. on sales value.
- Meta: switched to POAS in November 2025, exactly at the boundary between the compared periods. Imported value and the multiple are not comparable year over year; the 43.4% and 75.6% drops are consequences of the change in unit of measurement.
- Comparable metrics: budget, purchases, link clicks, impressions, reach and cost per purchase. Every claim in this document is based on them.
- Attribution: same platform, same account, same window, unchanged model (7-day click or 1-day view). Google volume is in conversions, Meta volume in purchases – two different systems that can't be added together.
- Budgets: at the client's request, we publish percentage changes, not absolute figures. The cost columns are covered in the screenshots.
- Limitation: the results reflect one specific account, category and period. They are not a promise of performance.