 DispoTrading
How DispoTrading grew net profit by 77.1% on a 58.9% bigger budget
+77.1%
Net profit
1,614,645 → 2,860,159 RON
2.75x
Net POAS on the added budget
every extra RON returned 2.75 RON in profit
2.34x
Blended net POAS
up from 2.10x the year before
+55.9%
Conversion volume
33,825 → 52,725, both platforms
POAS Profit on Ad Spend
The net profit earned for every RON spent on advertising. Unlike ROAS (Return on Ad Spend), which reports revenue, the value sent to the platforms in this account already has cost of goods, shipping, packing and VAT deducted, and cancelled orders are removed daily.
Throughout this case study, net POAS means exactly this value: profit before fixed costs (salaries, rent) and before ad spend. It is not the company's final profit and it is not revenue.
This case study was produced by the performance marketing agency BigConvert, based on data from the accounts we manage.
The data was checked and validated by the team at DispoTrading.
- Industry
- Professional cleaning
- Services
- POAS, Google Ads, Meta Ads
- Market
- Romania
- Period
- Jan 1 - Aug 13, 2026
I've been able to step away completely, first and foremost because I trust there's no chance I'll lose money.
0:24 · filmed at the client's office
The problem
The account had already bought everything it could buy
This wasn't a performance problem, it was an architecture problem: the structure had stayed the same while the budget kept growing on top of it. Three signals pointed the same way.
-
Volume ceiling
+43.0%
Budget, for just +5.8% more clicks
The account was paying more and more for traffic that grew more and more slowly.
-
Cannibalization
2
Campaigns on the same inventory
Shopping and Performance Max were competing with each other, and the algorithm was learning from data split in two.
-
Untapped headroom
1.70x
Net POAS on Meta, the weakest in the account
The usual reaction is to cut its budget. But it was the only place with an untapped audience.
The decision
Structure before budget, and budget where there's headroom
The account was run on net POAS: COGS, shipping, packing and VAT are deducted from the values sent to the platforms, and cancelled orders are removed daily. So every bidding decision was made on real profit.
-
Google · consolidation
91.9%
Of the Google budget, through a single campaign type
Shopping dropped by 74.0%, while Performance Max got 66.8% more. It absorbed the budget without losing efficiency: net POAS went from 1.97x to 2.15x, and every additional RON produced 2.41 RON in net profit.
-
Meta · scaling
+96.5%
Budget on the channel that looked weakest
Net profit grew by 167.3%, purchases by 137.6%, and net POAS climbed from 1.70x to 2.31x. Every RON added produced 2.94 RON - the best marginal return in the account.
| Campaign type | Budget | Net profit | Net POAS |
|---|---|---|---|
| Performance Max | +66.8% | +81.6% | 1.97x → 2.15x |
| Search | +11.5% | +21.0% | 6.36x → 6.90x |
| Shopping | −74.0% | −77.3% | 2.37x → 2.07x |
| Demand Gen | −27.5% | +15.7% | 0.69x → 1.11x |
The result
Profit grew faster than the budget
Budget and net profit, indexed to 100
100 = the same calendar window in the previous year
Net profit grew by 77.1%, while the budget grew by 58.9%. The gap between the two lines is the only thing that matters in an account run on profit, not on revenue.
| Metric | Previous year | 2026 | Change |
|---|---|---|---|
| Net profit | 1,614,645 RON | 2,860,159 RON | +77.1% |
| Budget | confidential | confidential | +58.9% |
| Net POAS | 2.10x | 2.34x | +11.4% |
| Conversion volume | 33,825 | 52,725 | +55.9% |
| Net POAS on the added budget | - | 2.75x | - |
| Metric | Previous year | 2026 | Change |
|---|---|---|---|
| Net profit (before fixed costs) | 1,227,014 RON | 1,823,882 RON | +48.6% |
| Budget | confidential | confidential | +43.0% |
| Net POAS | 2.27x | 2.36x | +3.9% |
| Conversions | 24,894 | 31,502 | +26.5% |
| Clicks | 318,652 | 337,174 | +5.8% |
| Impressions | 16,046,833 | 18,491,254 | +15.2% |
| Net POAS on the added budget | - | 2.57x | - |
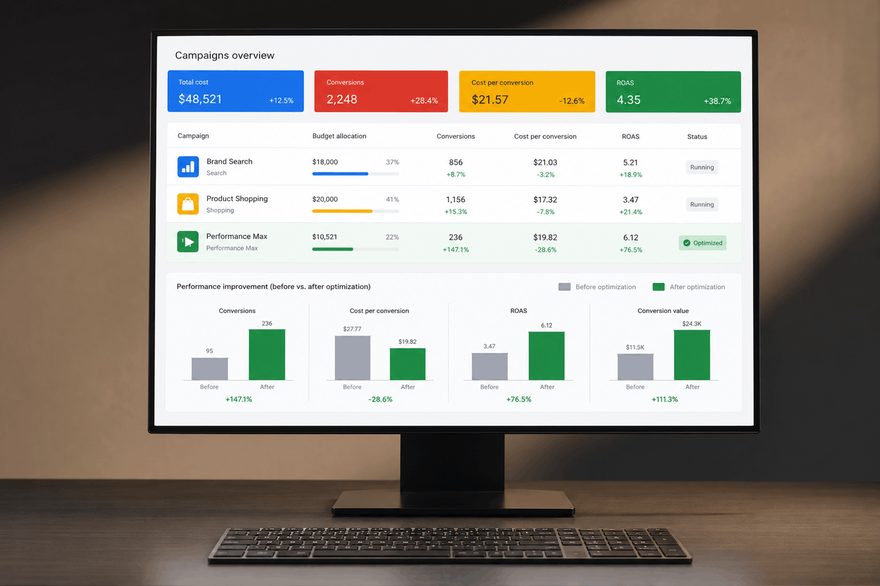
Google Ads · account screenshot
| Metric | Previous year | 2026 | Change |
|---|---|---|---|
| Net profit (before fixed costs) | 387,631 RON | 1,036,277 RON | +167.3% |
| Budget | confidential | confidential | +96.5% |
| Net POAS | 1.70x | 2.31x | +36.0% |
| Purchases | 8,931 | 21,223 | +137.6% |
| Link clicks | 253,052 | 503,641 | +99.0% |
| Reach | 3,367,289 | 6,824,508 | +102.7% |
| Impressions | 21,342,076 | 60,322,709 | +182.7% |
| Net POAS on the added budget | - | 2.94x | - |
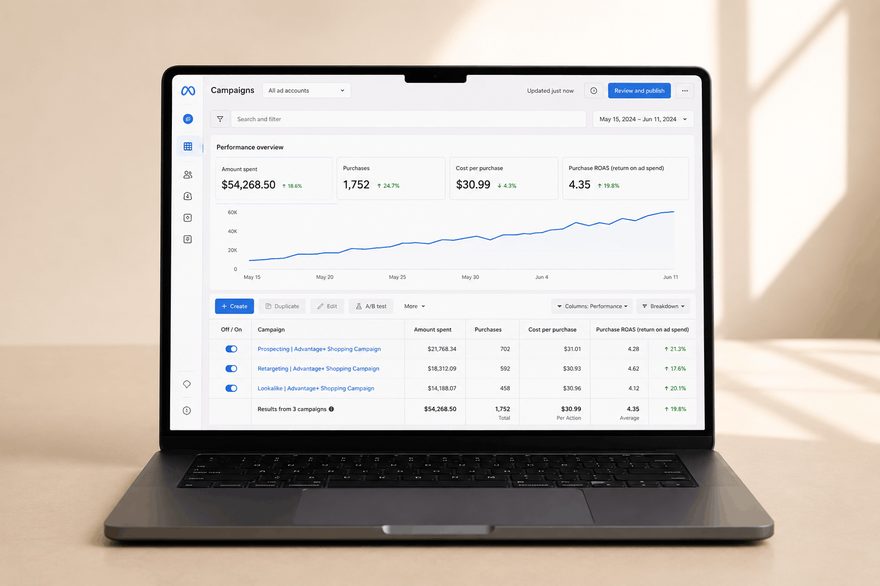
Meta Ads Manager · account screenshot
In all honesty
What we gave up and what we don't take credit for
No scaling decision comes for free, and part of the result would have happened without us.
-
Given up
−77.3%
Shopping profit
From 172,361 to 39,128 RON. The same products kept being bid on, more efficiently, through Performance Max.
-
Would have come anyway
10.0%
Of Google profit came from brand
Three brand campaigns produced 182,183 RON at a net POAS of 31.28x, on demand that already existed. Without them, non-brand Search ran at 2.31x, up from 2.06x - the figure that measures new demand.
-
What the numbers are not
Profit, not revenue
Before fixed costs and before ad spend
The account sends margin to the platforms, not revenue.
See more about the methodology
Sources, units of measurement, attribution, exclusions and what can't be added together.
Methodology and data notes
- Source: campaign-level exports from Google Ads and Meta Ads. Google totals are calculated from campaign rows only, after removing 7 Total rows.
- Conversion value: net profit, calculated before it is sent to the platforms. COGS, shipping, packing and VAT are deducted from revenue, and cancelled orders are removed daily. So the value/cost ratio is net POAS, not ROAS.
- Budgets: at the client's request, we publish percentage changes, not absolute figures for cost, cost per result and CPM.
- Comparability: each platform is compared with itself, year over year, on the same attribution model, so the differences between Google and Meta don't affect the percentages.
- Attribution: figures as reported by the platforms (Meta: 7-day click or 1-day view). Both can attribute the same order, so the blended total is reported profit, not the store's net profit; the overlap exists in both years, though.
- Meta verification: conversion value doesn't exist as a column in the export. It was read from Ads Manager and verified by recalculating it from budget × POAS; the two results matched.
- Blended volume: adds up Google conversions and Meta purchases, two different counting systems. Same convention in both years.
- Exclusions: Display (under 0.1% of the budget) and Video (no spend) were excluded from the channel analysis.
- Limitation: the results reflect one specific account, category and period. They are not a promise of performance.